Why store conversion falls short
When a brand sells through retailers, it cannot see its sales by area and by week, and the temptation is to measure out-of-home with the tools of programmatic digital out-of-home. Drive-to-store counts how many phones exposed to the Campaign later visit a store, and retargeting serves mobile ads to people who passed near a screen. They are useful tactics for specific Campaigns.
They fall short when they become the measure of out-of-home. They track what happens in the following days and credit the result to the last touch, so they treat out-of-home as a direct response medium. For a shampoo, fragrance or food brand, purchases repeat over months and are decided at the retailer's shelf, and what tips that decision is the brand being present in the shopper's mind, an effect a store conversion rate does not capture.
What out-of-home contributes to these brands
The Ehrenberg-Bass Institute, building on Byron Sharp's work in How Brands Grow, calls it mental availability: the brand coming to mind when the consumer is ready to buy.1 A medium with broad reach and a continuous presence on the street can help build it.
Effectiveness studies point the same way. In The Long and the Short of It, published by the IPA in 2013, Les Binet and Peter Field put the optimal budget split at 60% for brand building and 40% for activation, and in 2018 they found an almost identical ratio, 62 to 38.2 Thinkbox's study of advertising profitability in the UK estimates that 58% of the profit advertising generates arrives after the first three months.3 A metric that only looks at the days after the Campaign leaves out most of that effect.
Optimal budget split according to Binet and Field (IPA)
When advertising profit arrives, according to Thinkbox
Three measurement layers
Brand tracking by area. A regular survey of awareness, consideration and preference in areas with out-of-home and comparable areas without it, before, during and after the Campaign, measures the effect on the brand directly. It is the measure closest to mental availability and does not depend on retailer data.
Share of search. In 2020, at an IPA conference, Les Binet presented share of search: the brand's organic searches divided by those for all brands in its category. In the sectors he analysed it moved with market share and anticipated it, by up to a year in the case of cars.4 A later IPA study of 30 cases across 12 categories and seven countries found that share of search equals 83% of market share on average, a correlation that does not imply causation.5 It can be checked by region and week, so it can be compared between areas with and without out-of-home.
The marketing mix model with consumer sales. Store audits, such as NIQ's, and household panels, such as Worldpanel by Numerator, measure consumer sales by region.67 With that data, a marketing mix model can estimate the effect of out-of-home on base sales and how long it lasts, which is where brand building shows. The IAB and MRC measurement guidelines also recommend that retailers give brands data by area and period for their models.8 We explain this in more detail in How to bring out-of-home into your marketing mix model.
| Layer | What it measures | Horizon | Where it comes from |
|---|---|---|---|
| Brand tracking by area | Awareness, consideration and preference. | MediumDuring and after the Campaign. | Survey in areas with and without out-of-home. |
| Share of search | Interest in the brand relative to its category. | ContinuousWeekly, read over months. | Organic searches by region. |
| Marketing mix model | Effect on base sales and how long it lasts. | LongYear and beyond. | Consumer sales panels by region. |
How to combine them
The three layers answer different questions and are read at different paces. Share of search gives a weekly signal of whether the Campaign moves interest in the brand in the areas where it runs. Brand tracking confirms, at the end of the Campaign, whether awareness and preference have changed. And the marketing mix model, once or several times a year, turns all of that into sales and profit for the conversation with finance, as we explain in How to make the case for out-of-home investment with business data.
Drive-to-store and retargeting can sit alongside this measurement as tactical indicators for digital out-of-home Campaigns, useful for optimising each Campaign. The value of out-of-home for the brand is demonstrated with the three layers above.
- DaysDigital out-of-home visits and conversions. Tactical indicator.
- WeeksShare of search by area.
- End of CampaignBrand tracking in areas with and without out-of-home.
- YearMarketing mix model: base sales, persistence and profit.
The data that links the three layers
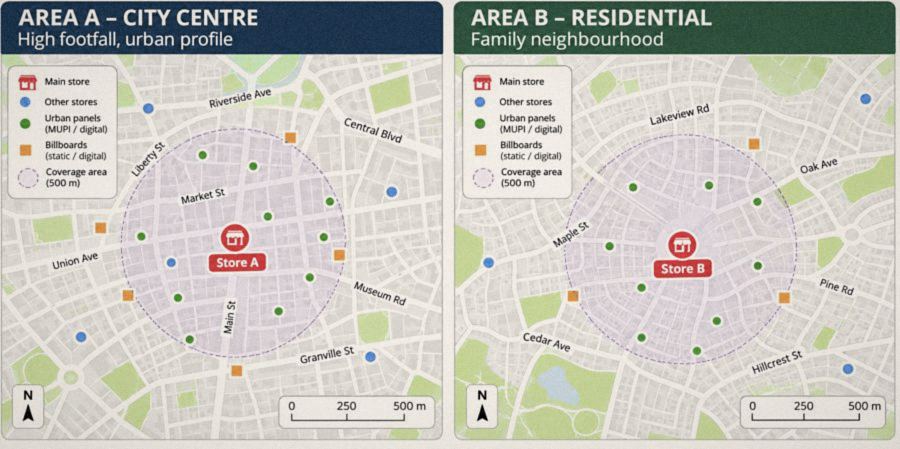
All three layers need to know where and when the Campaign ran. Brand tracking compares areas with and without out-of-home, share of search is read by region and the marketing mix model needs out-of-home presence by area and by week. If you know precisely which faces were live, where and from what date, all three measurements can be matched with the Campaign. If that data is approximate, none of the three can reliably attribute the effect to out-of-home.
Out-of-home data originates in OS.ooh
In OS.ooh, every face has its exact location and its actual posting date with proof. The Campaign is recorded by area and by week, ready to be matched with brand tracking, share of search or the marketing mix model.
Sources
- WARC, "Ehrenberg-Bass Institute's three pillars of physical", on the mental and physical availability concepts from How Brands Grow. warc.com
- IPA, "The next chapter for The Long and The Short of It", 13 September 2023. ipa.co.uk
- WARC, "58% of advertising profitability occurs after the first three months", on the Thinkbox study, 25 April 2024. warc.com
- IPA, "Binet presents fast, cheap, predictive Share of Search metric", 14 October 2020. ipa.co.uk
- Marketing Week, "Share of search represents 83% of a brand's market share, think tank finds". marketingweek.com
- NIQ, "Retail Measurement Services". nielseniq.com
- Marketing Directo, "Kantar Worldpanel cambia de nombre: ahora es Worldpanel by Numerator", 4 July 2025 (in Spanish). marketingdirecto.com
- IAB and MRC, "Retail Media Measurement Guidelines", January 2024. iab.com