
What a marketing mix model is
A marketing mix model relates sales, or another business outcome, to spend in each channel over time. It also accounts for price, promotions, seasonality and other factors that move sales. It works with aggregated data and does not track individuals, which is why it suits media such as TV or out-of-home, where there are no clicks to count.
Its use has grown in recent years. In January 2025 Google opened Meridian, its open-source model, to every advertiser, with a programme of more than twenty certified measurement partners. Meridian can be calibrated with the results of incrementality experiments and works with reach and frequency as well as impressions.1 Meta maintains Robyn, another open-source model.2
According to IAB's State of Data 2026 report, 67% of planning and analytics leaders at US brands and agencies use marketing mix models. The same report says the industry's goal is to move from updating them once or twice a year to doing so every month.3
Which channels are worst represented
IAB asked model users which channels they thought were under-represented. Every channel receives some mentions, and the group covering radio, print, out-of-home and direct mail is among the most cited. Digital out-of-home, asked about separately, gets a similar result.3
The report puts part of the problem down to teams spending much of their time stitching together scattered data before they can analyse it, and to models tending to favour digital channels, which deliver continuous, detailed data.4
In out-of-home, the problem usually starts with the input data. The model often receives each Campaign's total spend in the month it was invoiced, at national level and with no audience. It therefore cannot tell which faces were up each week or in which areas, and the out-of-home effect blends into that of other channels. The risk is that the model credits out-of-home with less than it contributes, and that next year's budget is cut as a result.
Out-of-home is also usually a small line in the media plan. An analysis published in October 2026 by Keen Decision Systems and Accretive on the advertisers using their platform puts it at 1.6% of media spend, and says 89% of brands using it see a profitable return.5 These are vendor figures and the methodology is not disclosed. With a line that size, data quality weighs even more on what the model concludes.
What data out-of-home needs to enter the model properly
This data is usually spread across the media plan, the proof of posting, the invoices and the audience provider. Typically someone gathers it at the end of the year to feed the model, at whatever level of detail the sources allow.
| Data | Usual | What the model needs |
|---|---|---|
| SpendWhat the Campaign costs. | MonthlyTotal amount, in the invoice month. | WeeklyCost spread across the weeks the Campaign was up. |
| DatesWhen each face was live. | BookedOrder dates. | ActualPosting and removal according to proof of posting. |
| GeographyWhere the Campaign ran. | NationalOne figure for the whole country. | By areaRegion, town or postcode of each face. |
| AudienceHow many people it could reach. | MissingSpend only. | ImpactsFrom the agency's audience provider, with the same metric across Campaigns. |
| FormatWhat type of site. | AggregatedAll out-of-home on one line. | DetailedBillboards, urban panels, screens or malls separately, if volume allows. |
| IdentifierHow it all links up. | DifferentEach department names the Campaign its own way. | SharedThe same code in the media plan, the invoice and the model. |
Operational data, from the source
There is an important difference between reconstructing out-of-home data and taking it from where it originates. When it is reconstructed, the starting point is what was booked and invoiced, and weeks and areas are estimated. When it is taken from the system where the Campaign is run, each data point reflects what happened: which face was posted, on which day, with which proof, at what cost and whether there was any issue.
That operational data gives the model information it almost never receives today. It can count only the faces that were up, use the exact days of exposure and deduct issues. Audience is added afterwards, from the provider the agency chooses, connected through an API. The result reaches the model with the same structure as the other channels, without anyone having to reconstruct it.
Reconstructed data
- Media planBooked dates and faces.
- InvoicesAmount per Campaign and month.
- Photos and emailsPostings with no link to the face.
- ReconstructionSomeone cross-checks sources and estimates weeks and areas.
- ModelReceives an approximation.
Source data
- Campaign operationsEach face, its cost, its GPS-stamped posting and its status, in one system.
- Audience via APIFrom the provider the agency chooses.
- ModelReceives the data by week and area, as delivered.
Out-of-home within omnichannel measurement
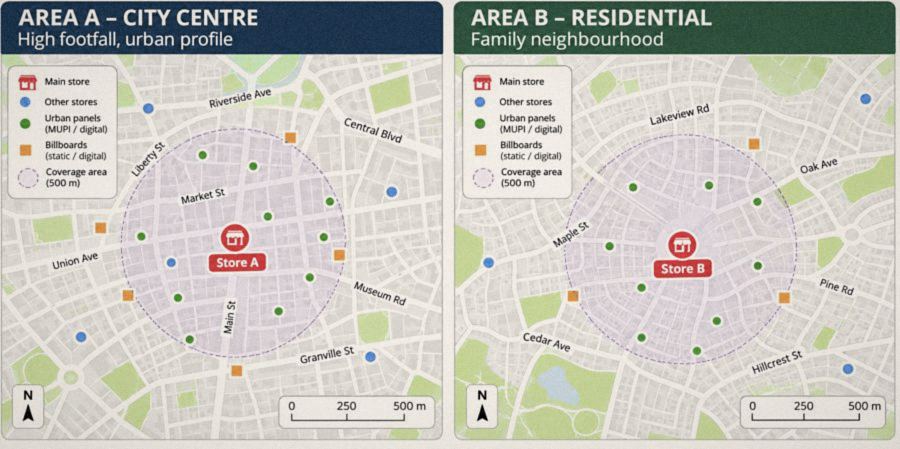
Out-of-home rarely works alone. A Campaign on the street can lift brand searches, web traffic or store visits in the areas where it runs, and part of that effect ends up credited to paid search or social. A marketing mix model can capture that relationship if it receives the data by area and by week.
One way to do it is to include brand searches as an intermediate variable. Google, for example, offers Meridian users search volume data alongside data on its own media.1 If searches rise in the areas with out-of-home, the model can split the credit more accurately between out-of-home and paid search.
The model also becomes more reliable when it is calibrated with experiments, for example by running the Campaign in some areas and not in others and comparing results. Meridian accepts those results as prior information to adjust its estimates.1 We explain how to design them in How to measure what out-of-home sells with area tests.
Where to start
- Take the data from the system where the Campaign is runFaces, actual posting dates, location, cost and status of each, as delivered.
- Gather the available historyFor past Campaigns, spread spend by week and area with the best information available.
- Add audience with a common metricUse the same provider and the same metric across Campaigns so they can be compared.
- Give each Campaign a shared codeThe same in the media plan, the invoice and the model, so nothing has to be reconciled by hand.
- Calibrate with an area testA Campaign live in some areas and not in others gives the model a benchmark to adjust against.
Out-of-home data originates in OS.ooh
The Campaign is run in OS.ooh, so every booked face, its actual GPS-stamped posting date, its status, its cost and its invoice are recorded in the same system. Audience arrives through an API from the provider the agency chooses. With all of that, OS.ooh delivers out-of-home data to the advertiser's marketing mix model by week and by area, as delivered, with no intermediaries rebuilding it.
Sources
- Google, "Meridian, our open-source marketing mix model, is now available to everyone", 29 January 2025. blog.google
- Meta, Robyn, open-source marketing mix model. facebookexperimental.github.io/Robyn
- IAB and BWG Global, State of Data 2026, February 2026. iab.com (via MediaPost)
- Inside Radio, "IAB finds ad models still undervalue audio", 4 February 2026. insideradio.com
- PPC Land, "Out-of-home turns a profit for 89% of brands that buy it, Keen data shows", 15 October 2026. ppc.land