
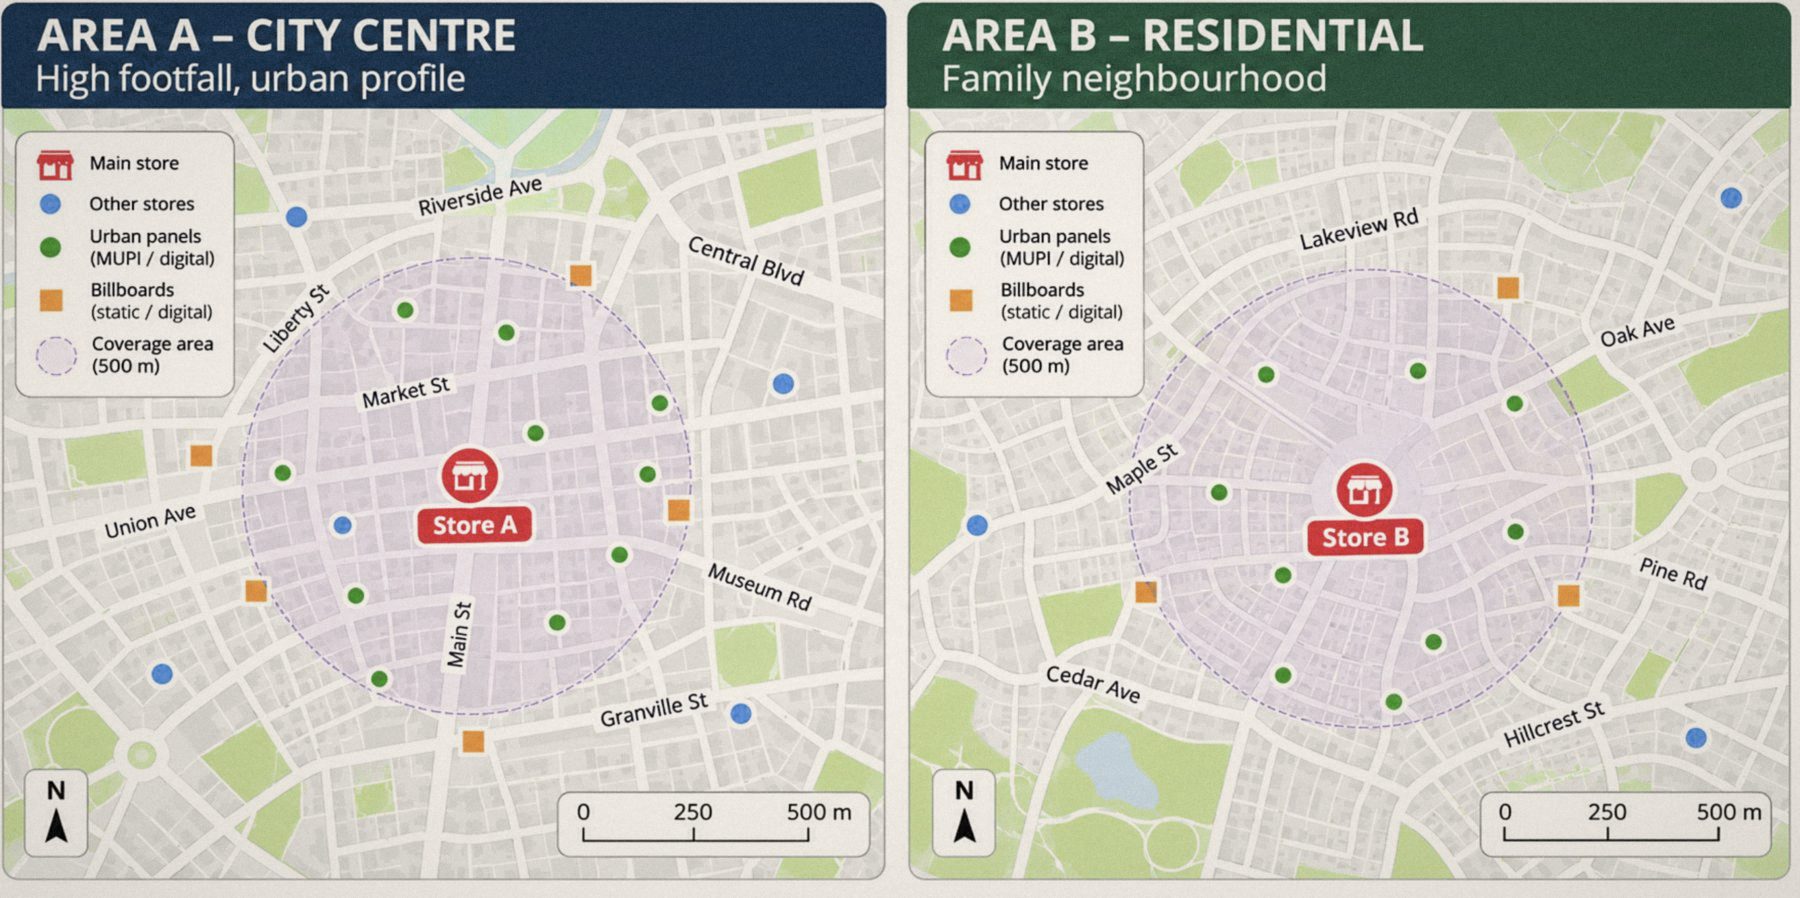
What an area test is
You start with a set of areas, which can be regions, cities or groups of postcodes, and their sales history. Some areas get the Campaign and others go without it as a control group. At the end, sales in the Campaign areas are compared with what would have been expected of them, based on how the control areas evolved.
Google described the method in 2011. Its quantitative analysis team explained that assigning areas at random guards against hidden biases between the two groups and allows for seasonal changes during the test.1 Meta maintains GeoLift, an open-source tool that uses the synthetic control method: it combines several control areas, each with its own weight, to build a benchmark that resembles the test areas as closely as possible.2
Why it suits out-of-home
Out-of-home is bought by location, so deciding where the Campaign runs and where it does not is a natural part of planning. A brand can leave several areas without out-of-home for a few weeks without disturbing the rest of the plan, and the test areas can be chosen to be comparable with the controls.
The test has to run long enough. The GeoLift guide recommends that it cover at least one full purchase cycle for the product, and its reference example uses ninety days of daily history to choose the areas.2 In out-of-home it should also match the actual display period, from the first posting to the last removal.
How to design it
- 1. The questionWhat you want to know and with which metric: sales, store visits, sign-ups.
- 2. The areasComparable areas with enough sales history.
- 3. The assignmentTest and control areas, at random or with synthetic control.
- 4. The CampaignOnly in the test areas, recording what was posted and when.
- 5. The calculationIncremental sales and profit, against the benchmark.
- 6. The useBudget decisions and calibration of the mix model.
The data that decides the result
If some faces in a test area were posted late or not at all, or if the Campaign spilled into control areas, the effect is diluted and the result underestimates what out-of-home contributes. That is why you need to know what was up in each area and from what date, with proof, as we explain in How does a brand know its Campaign actually ran?
On the sales side, figures need to be broken down by the same areas. Depending on the business, they can come from own stores, online orders by postcode or distributors' sell-out data. If the brand sells through chains or online stores and cannot see its sales by area, the approach changes, as we explain in How to prove the value of out-of-home when you don't control the sale.
| Data | What it is for | Where it comes from |
|---|---|---|
| Area definition | So sales and Campaign are measured on the same boundaries. | Regions, towns or postcodes agreed in advance. |
| Sales by area | To measure the result, by day or by week. | Own stores, e-commerce or distributors. |
| Prior history | To choose comparable areas and build the benchmark. | The same sales sources, going back. |
| Live faces by area | To know what was up, where and from when. | Dated, geotagged proof of posting. |
| Investment by area | To calculate incremental profit and return. | Cost of each face, linked to the Campaign. |
| Other media by area | To avoid another activity explaining the difference. | Media plan for the same period. |
How to use the result
The test result has three uses. It lets you calculate the Campaign's incremental profit and present it to finance, as we explain in How to make the case for out-of-home investment with business data. It helps calibrate the marketing mix model: Meridian, Google's open-source model, accepts experiment results as prior information to adjust its estimates.3 And it guides the next Campaigns, for example on duration or the areas where out-of-home performs best.
A single test gives a benchmark. Repeating it regularly, in different areas and at different times of year, shows whether the effect holds and lets you adjust the plan with more confidence.
The test data originates in OS.ooh
In OS.ooh, every booked face has its location, its cost and its actual posting date with proof. The test Campaign is recorded area by area, as delivered, ready to be compared with sales.
Sources
- Google Research, "Measuring Ad Effectiveness Using Geo Experiments", 9 December 2011, with the paper by Jon Vaver and Jim Koehler. research.google
- Meta, GeoLift, walkthrough of the open-source tool. GeoLift Walkthrough
- Google, "Meridian, our open-source marketing mix model, is now available to everyone", 29 January 2025. blog.google